- July 2, 2026
- Tejhaksh
- 0 Comments
- Tableau Desktop, Uncategorized
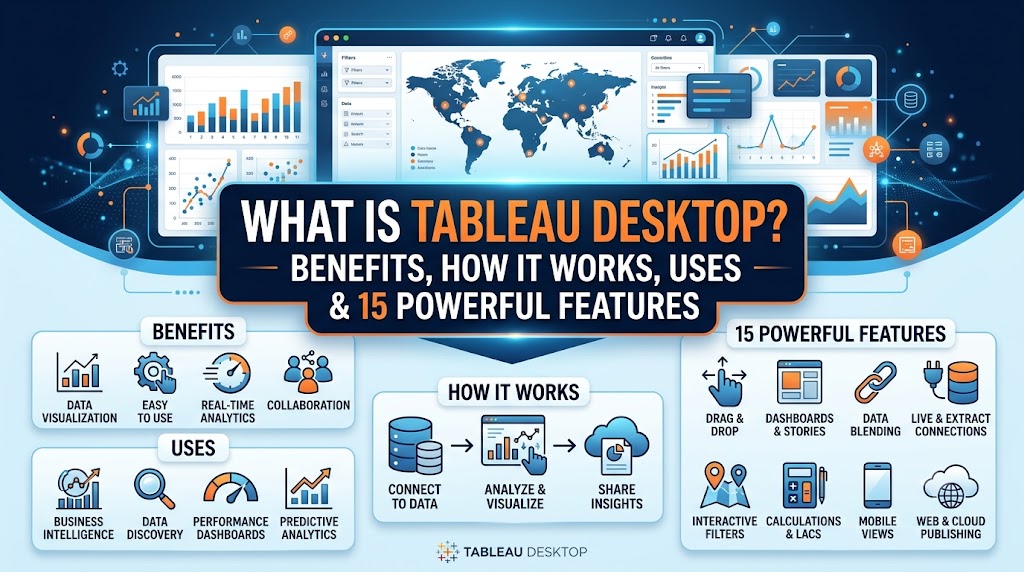
What is Tableau Desktop? Benefits, How It Works, Uses & 15 Powerful Features (2026)
The world of data is evolving rapidly today. Gone are the days when business reports consisted merely of static numbers on paper or computer screens—figures that often became outdated by the time they reached senior executives. To remain competitive in today’s market, companies require systems that are live, intelligent, and incredibly easy to use.
Tableau Desktop stands at the forefront of this new data revolution. Developed by Salesforce, it is widely regarded as the premier tool for visualizing and understanding data. Two major updates have recently been introduced:
- The basic version of Tableau Desktop is now completely free for everyone.
- It now incorporates the power of AI (Artificial Intelligence), enabling automated data analysis.
- These changes have fundamentally transformed the way companies operate.
Who is this guide for?
Whether you are a data analyst, aspiring to build a career in this field, or looking to drive your company’s growth through data, this guide will explain everything you need to know about Tableau Desktop in simple, accessible language.
What is Tableau Desktop?
Tableau Desktop is powerful software that transforms data into graphs, charts, and intuitive designs. You do not need to learn coding to use it.
It allows you to combine data from various sources and create stunning, interactive dashboards using simple ‘drag-and-drop’ actions. Unlike web-based tools, Tableau Desktop leverages your computer’s processing power. Consequently, it runs smoothly—without lagging—even when handling massive datasets containing millions of rows, all while working offline.
Major Evolution Over Time
Tableau has become far more advanced than before:
- Now completely free: Previously, there were limitations regarding connecting local databases, but the company has now made it free for everyone.
- The power of AI (Artificial Intelligence): It now integrates Tableau Agent (formerly known as Einstein Copilot).
- An intelligent partner: Thanks to this AI, Tableau has evolved from a mere charting tool into an intelligent partner. It can automatically write SQL code, structure your data, and detect any anomalies or changes within the dataset.

4 Major Benefits of Tableau Desktop
Using Tableau Desktop in any company or business yields immediate, significant benefits. It bridges the gap between technical data and day-to-day operations.
1. Speed to Insight
In the past, generating a report involved a long wait—requesting data from the team, waiting for SQL coding, and then manually creating charts in Excel. Tableau Desktop condenses this process—which used to take hours or days—into just a few minutes. Data updates automatically, allowing you to instantly spot changes or anomalies and make informed decisions.
2. Data Democratization
Since no coding is required, non-technical professionals—such as marketing managers, sales directors, or HR personnel—can easily use the tool. When every employee can independently view and understand data without hassle, reliance on others is completely eliminated.
3. Native AI Efficiency
You no longer need to be a data expert or scientist. The built-in AI (Artificial Intelligence) in Tableau Desktop handles complex tasks for you. It automatically cleans data, generates forecasts based on historical records, and uncovers hidden trends.
4. Enterprise Security
While simplifying workflows, the software also prioritizes robust security. It features strict data security protocols, allowing companies to control exactly how much data each employee can access. This ensures that critical and sensitive financial information remains secure and reaches only the right people.
How does Tableau Desktop work?
The primary purpose of Tableau Desktop is to convert raw and complex data into clear, interactive, and visually engaging dashboards that make information easy to understand. It connects to multiple data sources, processes the data, and transforms it into meaningful charts, graphs, maps, and reports—all through an intuitive drag-and-drop interface with little to no coding required. This enables businesses to analyze data faster, uncover valuable insights, and make informed decisions with confidence.
The complete workflow of Tableau Desktop is explained below in simple terms.
Step 1: Connect to a Data Source
First, Tableau Desktop is connected to the data source where your data resides. Tableau Desktop seamlessly connects to a variety of data sources, including:
- Microsoft Excel
- CSV and Text Files
- SQL Server
- MySQL
- PostgreSQL
- Oracle Database
- Google BigQuery
- Snowflake
- Amazon Redshift
- Cloud Applications and APIs
This allows you to easily access data located in different places from a single platform.
Step 2: Prepare and Organize Data
Once connected, Tableau Desktop enables you to clean, organize, and combine (via Joins or Relationships) the data as needed.
For example, if you have two separate tables—’Customers’ and ‘Orders’—Tableau allows you to link them and use them together in a single report. This significantly reduces the need to write separate SQL queries or manually prepare the data.
Step 3: Analyze the Data
Now comes the most crucial stage—data analysis.
Tableau Desktop’s drag-and-drop interface makes this process incredibly easy. You simply need to drag and drop your chosen data fields—such as Sales, Profit, Region, or Category—onto the canvas.
Tableau’s powerful VizQL (Visual Query Language) engine automatically generates the necessary queries in the background and displays the data as charts, graphs, maps, or interactive dashboards within seconds. This is why Tableau requires very little coding.
Step 4: Create and Share Dashboards
Once your analysis is complete, you can combine various charts and graphs to create an engaging dashboard.
You can then publish this dashboard to Tableau Cloud or Tableau Server, allowing your entire team or organization to access it from anywhere.
Users can view these live dashboards via web browsers, mobile apps, or platforms like Salesforce, Slack, and Microsoft Teams, enabling them to make better decisions based on real-time data.
In short, how does Tableau Desktop work?
Connect to data → Prepare data → Analyze using drag-and-drop → Create charts and dashboards → Publish to Cloud or Server and share with the team.
This simple process is what makes Tableau Desktop one of the world’s most popular data visualization and business intelligence (BI) tools.

Also read this:
Top 15 Microsoft Power BI Features You Should Be Using in 2026
What Is Big Data Technology? Types, Tools, Benefits & Future Trends Explained
What is Microsoft Azure? Complete Guide for Beginners (Features, Uses & Benefits)
Angular vs AngularJS Explained: Features, Limitations, Working, and Differences
Common Uses of Tableau Desktop
1. Business Performance Tracking
To monitor revenue, sales, profit, and other key KPIs on real-time dashboards.
2. Sales Analysis
To analyze sales performance, deal pipelines, and sales across different regions.
3. Marketing Analytics
To measure campaign success and ROI by analyzing data from platforms like Google, Meta, and LinkedIn.
4. Supply Chain Management
To enhance supply chain efficiency by monitoring inventory, shipments, and deliveries.
5. Financial Reporting
To make better financial decisions by analyzing cash flow, budgets, expenses, and profits.
6. HR Analytics
To analyze employee performance, recruitment processes, and workforce data.
7. Customer Analysis
To formulate better business strategies by understanding customer behavior, purchasing habits, and preferences.
15 Powerful Features of Tableau Desktop
Tableau Desktop is not merely a data visualization tool; it is a powerful Business Intelligence (BI) platform equipped with modern technologies such as AI, real-time analytics, and interactive dashboards. Let’s explore its key features in simple terms.
1. Tableau Agent (Easy Data Analysis with AI)
Tableau Agent is an AI-powered feature that automatically generates charts, graphs, and reports by interpreting questions asked in natural language. For instance, if you type “Show sales reports for all Indian states,” Tableau Agent creates a visual dashboard within seconds. This makes data analysis faster and easier than ever before.
2. Ability to Connect Multiple Data Sources
With Tableau Desktop, you can integrate various data sources—such as Excel, CSV, SQL databases, cloud storage, and others—into a single project. This simplifies the analysis of data located in different places, providing a comprehensive view on one dashboard.
3. Tableau Pulse (Real-Time Business Monitoring)
Tableau Pulse continuously monitors your critical business data and KPIs. It provides instant alerts if there are sudden changes in sales, profit, or other key metrics. This enables quick identification of issues and facilitates timely, informed decision-making.
4. Live and Extract Data Connections
Tableau Desktop offers two types of data connections. A “Live Connection” displays real-time data from the database, whereas an “Extract Connection” creates a copy of the data to generate reports quickly. Users can choose the option that best suits their needs.
5. Smart Data Modeling
Creating relationships between different tables is incredibly easy in Tableau Desktop. You can join multiple data tables and perform accurate analysis on large datasets without writing complex SQL queries. This keeps data organized and ensures greater accuracy in reports.
6. Dynamic Dashboard Design
Tableau Desktop allows you to create interactive dashboards that adapt to the user’s specific needs. Information can be displayed differently based on filters, parameters, and user permissions, ensuring that each user sees data tailored to their needs.
7. AI-Based Dashboard Design
With the help of AI in Tableau, you can create attractive color themes, optimized layouts, and professional dashboard designs. This not only makes reports visually appealing but also makes the data easier to understand. Modern design options make your dashboards more impactful and user-friendly.
8. Advanced Charts and Visualization
Tableau Desktop allows for the easy creation of not just standard bar and pie charts, but also advanced visualizations like Sankey diagrams, heat maps, tree maps, radar charts, and geographic maps. This enables data to be presented in a more engaging and comprehensible manner.
9. Maps and Geographic Analysis
If your data is linked to specific locations, Tableau Desktop enables the creation of interactive maps. This allows you to analyze sales, customer data, or other metrics based on cities, states, or countries.
10. Dashboard Summary (Smart Insights)
Tableau provides a summary of key data from your dashboard. This allows users to easily grasp major trends and significant changes without having to examine the entire dashboard in detail.
11. Microsoft 365 Integration
Tableau Desktop integrates seamlessly with Microsoft Excel, Word, and PowerPoint, allowing you to directly incorporate your reports and dashboards into presentations or documents.
12. Advanced Calculations
Tableau Desktop offers a range of powerful calculation functions that facilitate complex calculations, custom formulas, and data analysis. It is highly effective for handling large and intricate datasets.
13. Dynamic Filters and Parameters
Tableau features dynamic filters and parameters, enabling users to filter data according to their specific needs and create interactive reports.
14. Secure Data Management
Tableau Desktop prioritizes data security. It includes features such as user permissions, access control, and backups, ensuring data remains secure and easily recoverable when needed.
15. Cross-Database Analysis
A key strength of Tableau Desktop is its ability to aggregate information from diverse databases and data sources into a single dashboard. This consolidates business-wide data in one place, facilitating better decision-making.

Differences between Tableau Desktop, Tableau Cloud, and Tableau Prep
The Tableau platform consists of various tools, each serving a distinct purpose. Tableau Desktop is used for analyzing data and creating dashboards; Tableau Cloud is used for sharing and accessing those dashboards online; and Tableau Prep is used for cleaning and preparing data.
Tableau Desktop
- For analyzing data and creating interactive dashboards.
- Reports can be generated by combining multiple data sources.
- Easy to use, featuring a drag-and-drop interface.
Tableau Cloud
- For publishing and sharing dashboards and reports online.
- Team members can view data from anywhere via a web browser or mobile app.
- Facilitates real-time collaboration and secure data sharing.
Tableau Prep
- For cleaning, filtering, and transforming data.
- Prepares data from various sources for analysis.
- Helps correct erroneous, duplicate, or incomplete data.
Key Capabilities of Tableau
- Combining multiple data sources: Data from Excel, SQL databases, cloud storage, and other sources can be used together.
- Merging data based on common fields: Different datasets can be easily combined using common fields like Customer ID, Date, or Region.
- Filtering multiple reports simultaneously: A single filter can be applied across multiple dashboards and worksheets at once.
Analyze data directly from multiple sources without the need for complex data migration, reducing both time and operational effort.
Summary: Getting Started on Your Journey
Data is only as valuable as the decisions it inspires. Tableau Desktop stands out because it balances sophisticated data science capabilities with human-centric, beautiful UI design. By making the application free for local database exploration and integrating proactive, agentic AI assistants, Salesforce has ensured that deep analytics is accessible to everyone.
If you want to transition your organization into a truly predictive, data-fluent operation, there is no better starting point than downloading Tableau Desktop, connecting to your data stack, and letting your insights come to life.
To watch a deep dive into the absolute latest data transformation improvements and cloud scaling mechanics introduced to the ecosystem, check out this Tableau Prep and Cloud Engine Feature Breakdown. This video clarifies how backend optimizations like Hyper as a Service work hand-in-hand with your desktop authoring environment to handle enterprise-level data without breaking a sweat.
Leave a Comment